Research
The research addresses the following questions:
- How does an ice stream flow?
- Was NEGIS active during the glacial period and is it speeding up now?
- How do the basal structures form and do they contain buckling interglacial ice or refrozen water?
- How do the basal structures influence the ice flow?
- What data are needed from ice streams to predict the evolution of the ice stream in a changing climate?
Observing the North East Greenland ice stream

A look at the radio-echo-sounding (RES) image shows that there are three very distinct zones to monitor:
a) The center of the ice stream where the ice has well-defined internal layering and the flow can be characterized as block flow with basal melting and sliding
b) The margins of the ice stream where the ice rips from the surrounding ice
c) The large basal structures on the outside of the ice stream where the ice folds and buckles before it reaches the margins of the ice stream.
The area around the EGRIP drill site contains all three zones within 30 km and is ideal for the IceFlow studies.
The EGRIP ice core and borehole measurements will allow for studies of the deformation of ice and the possible presence of water at the EGRIP site. Instruments from AWI have been used for detection of ice-crystal orientation and we will attempt to develop an observation method to observe ice-crystal boundaries from sublimation of the surface of a cleaned ice-core surface (in collaboration with our partners from AWI).
To observe the three zones, we have invested in a very sophisticated Ultra-Wide-Band (UWB) surface radar (developed by our partners at University of Kansas and Alabama) which makes measurements along very detailed surface grids in the relevant areas. In additon, another radar the Mills Cross radar is co-funded with U. of Alabama and AWI and will have a very high vertical resolution. Both radars have now been tested at EGRIP. The radars are placed on balloon sledges and are pulled over the surface by a tracked vehicle. This allows for a higher resolution than obtained with the faster-moving airborne RES setup.
In addition, drones will be deployed to map very detailed surface elevations in the region, and repeated mapping will be used to calculate ice velocities.
To study and understand the basal structures our plan was to use the rapid access drill RADIX (developed by our partners at the University of Bern) to penetrate into the structure 25 km to the SE of the EGRIP camp to obtain samples of the structures. Measurements of stable water isotopes on the ice cuttings would be used to determine the origin of the ice in the basal structures. In 2018, an attempt was made to drill a rapid access hole (diameter 2 cm) through the 2600 m thick ice, approx. 28 km from the EGRIP camp. Read about the day to day progress for the 2018 attempt in the EastGRIP Field Diaries June 26 - July 19, 2018.
Using the observations to gain insight
All our proposed observations are targeted towards understanding the flow and deformation of ice in and around the NEGIS ice stream and span from microscale studies of ice crystals to macroscopic observations of the RES layers, surface and bedrock elevations.
As a very central part of the project is developing anisotropic ice-flow models of the ice-stream flow and the formation of the basal structures that are most like strongly related to the ice-crystal structure. The ice-crystal orientations, ice-deformation studies and ice-crystal size information will support the development of novel continuum mechanics models needed for materials (ice) with memory-dependent constitutive equations.
Observations of sliding and flow in the EGRIP borehole and surface RES data will be used in numerical models to simulate the shear margins and the formation of basal bumps. We will use existing numerical models (full-Stoke models, e.g. ElmerICE and Uá); but we will need to expand the models further to include anisotropic flow and the behavior at the margins. We will also develop more detailed models for basal sliding and behavior of deformation near the shear margins.
Broadening the picture
The NEGIS is accelerating at the oceanic margin2. Satellite-data-based studies (IMGraft3) from our group indicate that the acceleration creeps inland. The accelerating flow is related to the warming ocean that lubricates and melts ice at the base of the ice stream as it flows into the ocean. We have a strong collaboration with the researchers on AWI’s research vessel “Polarstern”. They had a program at the 79°N ice stream in the years 2016-2018 (GRIFF). In addition, activities at the Villum Research Station related to the study of the ice streams will be included. Each year we host an annual workshop on NEGIS , where we gather the international groups working on the Greenland ice streams with a special focus on NEGIS. This ensures synergies in the NEGIS community and a direct use of the ice-flow-related information on ice streams and ice flow that we intend to develop The IceFlow project will add knowledge and play a key role in linking the behavior of the interior parts of the ice stream with the acceleration of the outlets. As a final step, the models developed for the EGRIP area will be generalized so the processes can be included in ice-stream models in general.
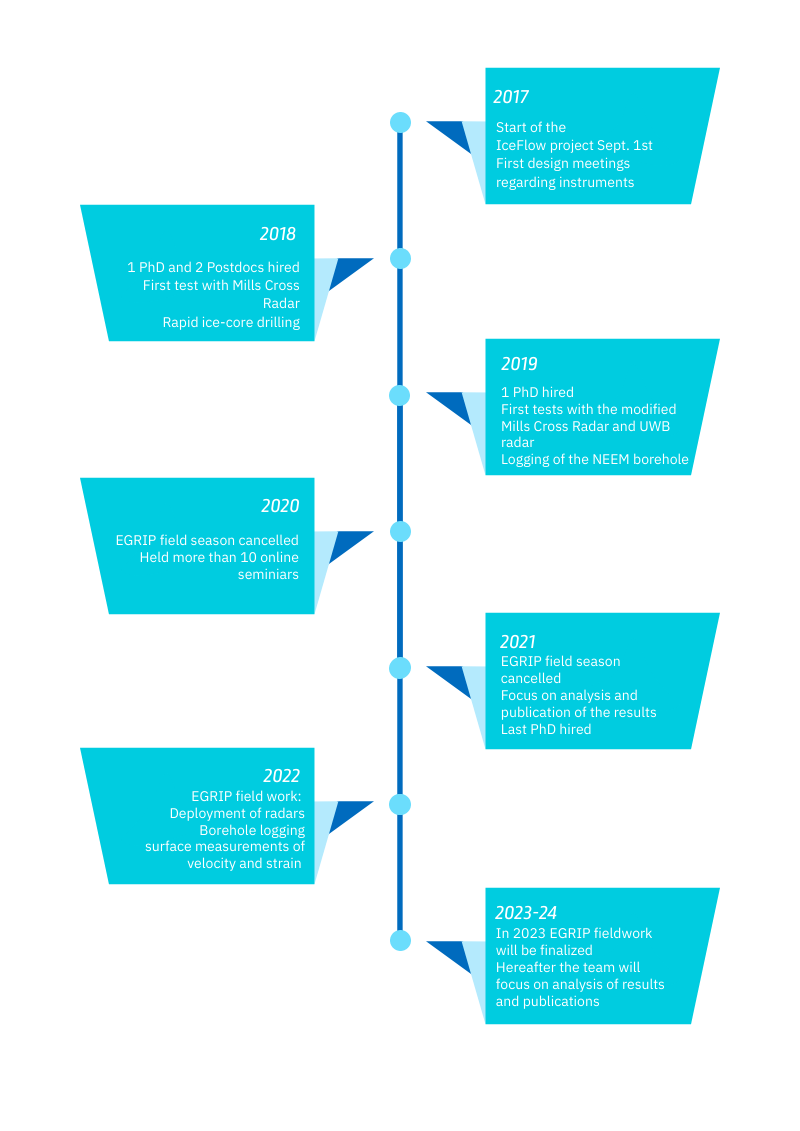
Time line

2: Khan, S. A. et al. Sustained mass loss of the northeast Greenland ice sheet triggered by regional warming. Nature Climate Change 4, 292-299, doi:10.1038/nclimate2161 (2014).
3: Messerli, A. & Grinsted, A. Image georectification and feature tracking toolbox: ImGRAFT. Geoscientific Instrumentation Methods and Data Systems 4, 23-34, doi:10.5194/gi-4-23-2015 (2015).
