The peculiar residual correlation (see [1706.04191]) persists when the data are cleaned and the template subtracted in the way prescribed by LIGO in the LOSC event tutorial. To demonstrate this, we have modified the 15th cell of the tutorial notebook (under the section titled Matched filtering to find the signal) in order to plot the cross-correlation between LIGO's residuals.
There are two new segments of code in the modified version, both clearly marked by comments. The first saves the matched templates so they can be used after the loop. The second calculates and plots the cross-correlation between the residuals. Note that the residuals used for this plot are identical to those calculated and plotted in the original code provided by LIGO. The cross-correlation between residuals is calculated in the same way described in our previousy published comments and the corresponding Python code.
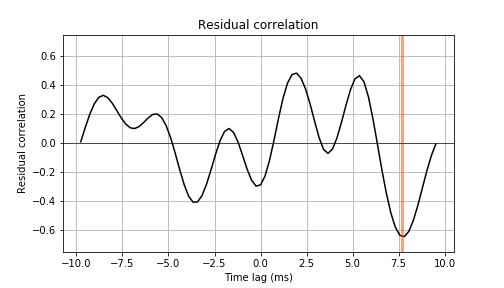
The result is the image below. A pronounced peak in the cross-correlation is present at a time lag of around 7 ms.
This link contains the modified LOSC tutorial that produces the figure above. Two additional blocks of code to produce this figure are marked by comments.